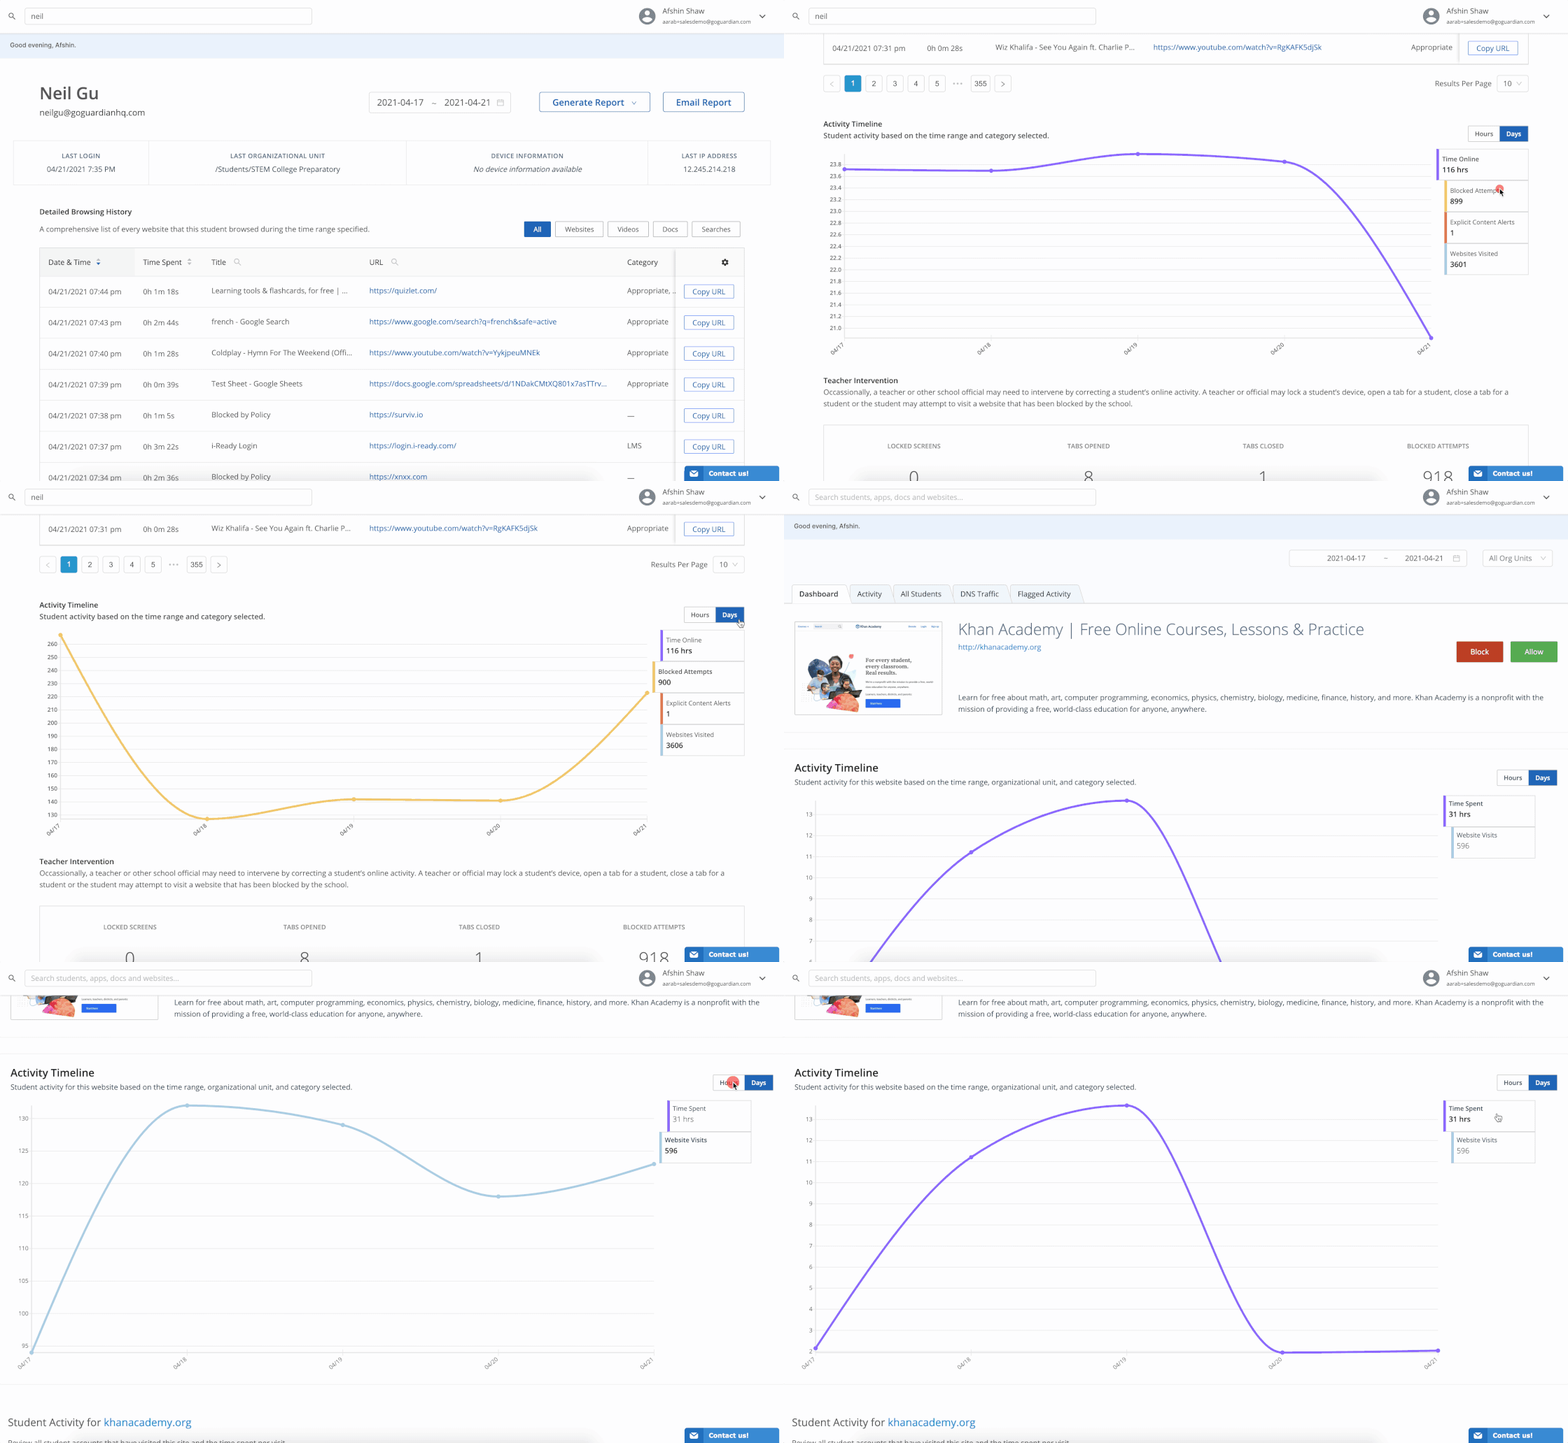
We have released Part 1 of our multi-phase Student Engagement Analytics project, which addresses one of our shared customer problems and the primary data point relevant to our users during remote learning - understanding trends in student engagement.
This Part 1 release adds several new time-series charts on the following pages:
- Student Report page: Four time-series charts to help spot trends for time spent online, blocked attempts, explicit content alerts, and visited websites by the student.
- Entity Details page: Two time-series charts to display patterns for time spent and visited websites for the site by all students.
